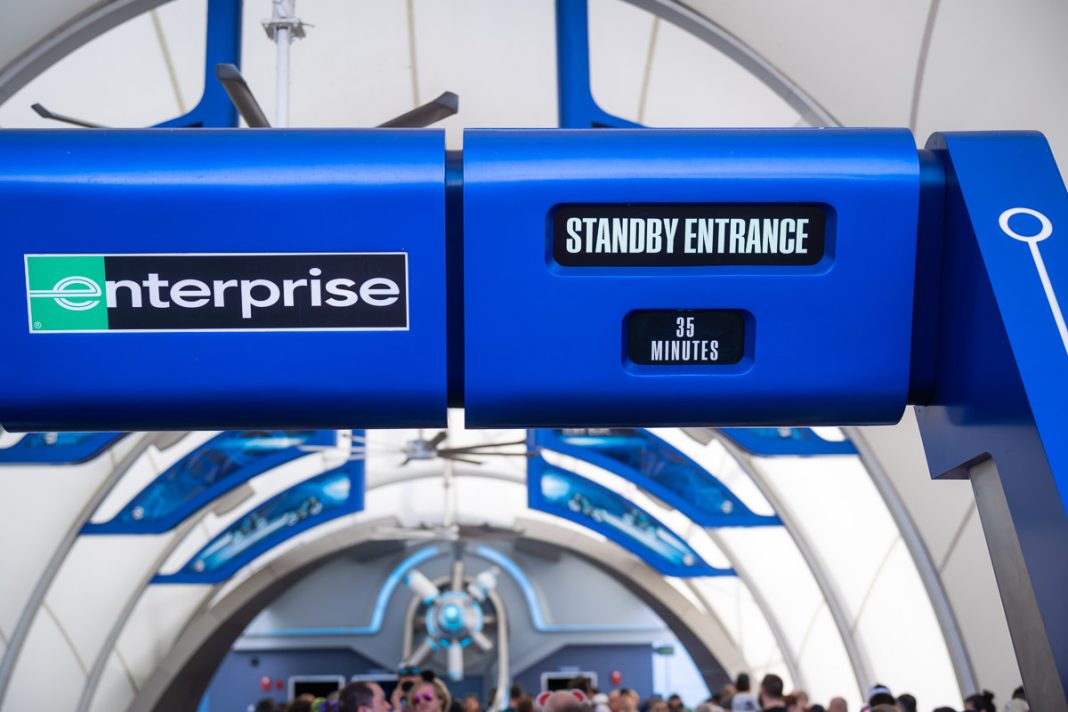
Walt Disney World has made major changes to queueing over the last 6 months. This post combines wait times data for standby lines and stats for Lightning Lane availability with our own anecdotal experiences with both plus ‘feels like’ crowds every single month since June to paint a picture of how things have changed in the second half of 2024.
Let’s start with crowd levels as measured by wait times data. Suffice to say, it’s been a down year for Walt Disney World with a gradual decrease in monthly crowd levels between February and October. In a normal year, there would be a noticeable spike for spring break and Easter, followed by a shoulder season slowdown and then a summer uptrend.
Instead, this year saw a slow and steady decrease. It’s especially rare for May to be busier than July, which is something that never happens–but did in 2024! It was a slow summer at Orlando’s theme parks, as we discussed at length in Summer (Still) Is NOT High Crowds Season at Walt Disney World.
Unsurprisingly, August continued that trend and September accelerated it. That much is to be expected–those two months being the slowest of the year happens every year. In this case, there was an 8-week stretch in there that was the slowest since 2021, though. So even quieter than normal.
In a normal year, October would buck that trend in a big way. Not the entire month, but fall breaks and the second half of the month would have a sufficient impact to make October the busiest month since spring break season. This year, October did see an uptrend–breaking the multi-month downtrend–but barely. A big part of that can be chalked up to hurricanes, though, and Disney itself indicated the storms cost them $130 million in cancellations.
November was up as compared to October, which is also typical–but it saw a bigger bounce, likely due to the aforementioned hurricanes depressing attendance in October. However, November still fell short of what’s normal for the month. And although December just began, the smart money would be on it being the busiest month of 2024. Not because of the next couple of weeks, but because the final two will be so high above the rest of the year that they’ll lift all of December.


It’s worth noting that all of this is wait time trends within 2024.
We usually do year-over-year comparisons, meaning we’d evaluate November 2024 vs. November 2023 (etc.) because it’s the more meaningful comparison that accounts for the seasonality of attendance trends. When doing that, every month except February and March were down year-over-year, and those two were within 1 minute of the prior-year. All other months have been down, some considerably so.
Also worth noting is that 2023 was mostly down as compared to 2022, which was the height of pent-up demand. This has been acknowledged by the company itself during earnings calls, so it’s not really in dispute. In fact, Disney CEO Bob Iger has more of less said as much and warned investors of attendance softness and demand moderation through 2025.
Previously, the company cautioned of a slowdown at Walt Disney World last year, too, attributing this to the end of revenge travel, lapping the 50th Anniversary, and poor weather. With that said, the company isn’t saying there’s been a massive drop in attendance. To the contrary, the most recent quarter saw “comparable” visitor numbers, suggesting attendance was flat or only down slightly. The wait times show a steeper drop.


The wait times data is what it is, and I don’t really think it’s up for debate. Contrary to some anecdotal reports, you are almost certain to encounter lower wait times this year versus 2023, not to mention as contrasted with 2022.
But as we often point out, crowd levels as determined by wait times (an imperfect measure, but the only worthwhile one) are not the same as ‘feels like’ crowds or congestion, which are more comparable to attendance (still imperfect, but closer). In a lot of cases, wait times don’t tell the full story. That’s true every year. We think that’s more so the case in late 2024 than ever.
What if the changes to queueing policies have caused lower wait times that are disproportionate with the decrease in attendance? That crowds have only dropped dramatically year-over-year if using wait times as their measure?


My theory is that exactly this has happened.
This would be perfectly consistent with Disney’s quarterly reports, which have (sometimes) mentioned declines in attendance and hotel occupancy, but not nearly to the degree of wait times.
The company’s financial reports are, as expected, about metrics such as income and per guest spending–not wait times. If attendance were down in comparable measure with wait times, we’d expect close to double-digit drops. That most certainly has not happened.


This means that there has almost necessarily been a divergence between posted wait times and feels like crowds. Attendance cannot have dropped by as much as wait times suggest. If it had, the Domestic Parks & Experiences would likely reflect that in its revenue and operating income.
Instead, Disney Experiences just posted record revenue and operating income for the full year–meaning it outperformed even the banner year of pent-up demand (at least financially).
This more or less comports with my anecdotal observations about Walt Disney World crowds. I’ve spent about 5-7 days each month in the parks since June, which obviously means I’m not seeing every day at every park. Even if I were, it’s impossible to be everywhere at once, and congestion can be highly variable.


Nevertheless, my perspective (and again, this is a sweeping generalization) is that the parks are not as busy as they were in 2022 and mostly down as compared to last year, but not nearly as slow as the wait times suggest. If I had to estimate crowd levels based purely on what I saw and felt–and didn’t look at a single posted wait time–I would pretty consistently be overshooting by 2-4 crowd levels.
Honestly, I can’t think of a single day I’ve visited in the second half of the year that I perceived as less busy than the crowd levels as dictated by wait times. It’s almost always been the exact opposite. There have been a lot of 1/10 to 3/10 dates that I would’ve guessed were closer to 5/10 based on simply strolling around the parks. But wait times told a very different story.
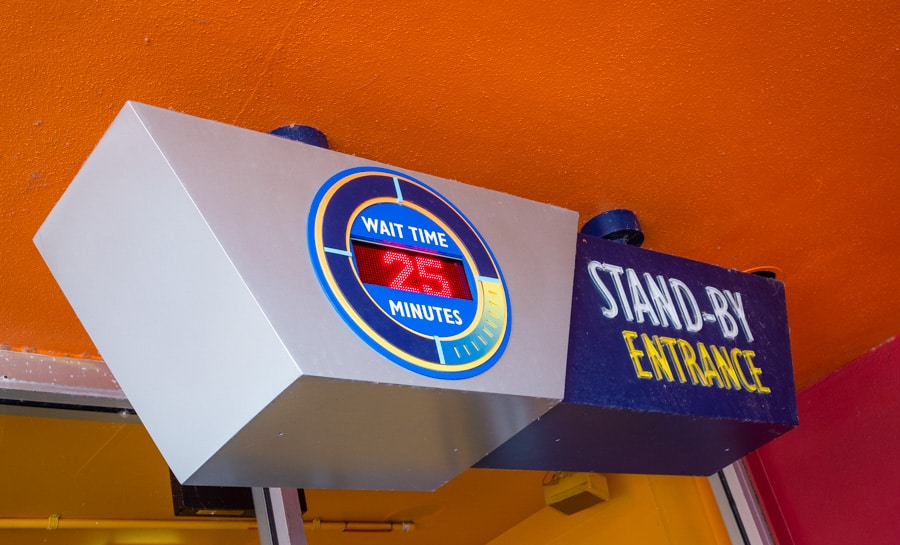

To that point, my experience with standby lines since June has been a breeze. Posted wait times have been manageable, they’re usually inflated, and the lines are constantly-moving. Of course, I’m mostly not doing rides at peak hours when waits are the worst, but I did do TRON Lightcycle Run ride testing at all hours over a holiday weekend and didn’t once wait even 60 minutes for it. (Posted wait times ranged from 35 to 120 minutes.)
In fact, my longest waits of the entire year have been for…Tiana’s Bayou Adventure. A ride that has a virtual queue. But that’s due to it breaking down repeatedly, and my knack for somehow managing to queue up just before that happens. That’s really beyond the scope of this post, but I nevertheless find it amusing that I’ve waited in line the most for an attraction that…isn’t supposed to have a line.
One thing to keep in mind here is that low crowds does not mean that every attraction is a walk-on. People sometimes hear 1/10 or 2/10 crowd levels and assume that’ll be the case. Instead, it means you might encounter a 65-75 minute average wait time for the most popular rides, as opposed to 90-120 minute wait times. Since those numbers are averages, it also means higher peaks and lower lows.


So what’s causing these disproportionately lower wait times?
My strong belief is that the key is a lower utilization rate of the Lightning Lanes. This means that fewer guests are skipping the line, and are instead in the regular line (or doing something else entirely). This would explain why the standby lines are moving more fluidly and why wait times are lower–because fewer guests are in the Lightning Lanes and processing that backlog isn’t causing standby to come to a standstill.
Previously, standard operating procedure called for a roughly 4:1 or 80:20 ratio of Lightning Lane to standby guests at the the attraction’s merge point. Meaning that for every one person admitted into the load area (or wherever merge occurs) through the regular queue, 4 people are pulled from the Lightning Lane line. This was the baseline–the ratio only gets less favorable for the standby line!
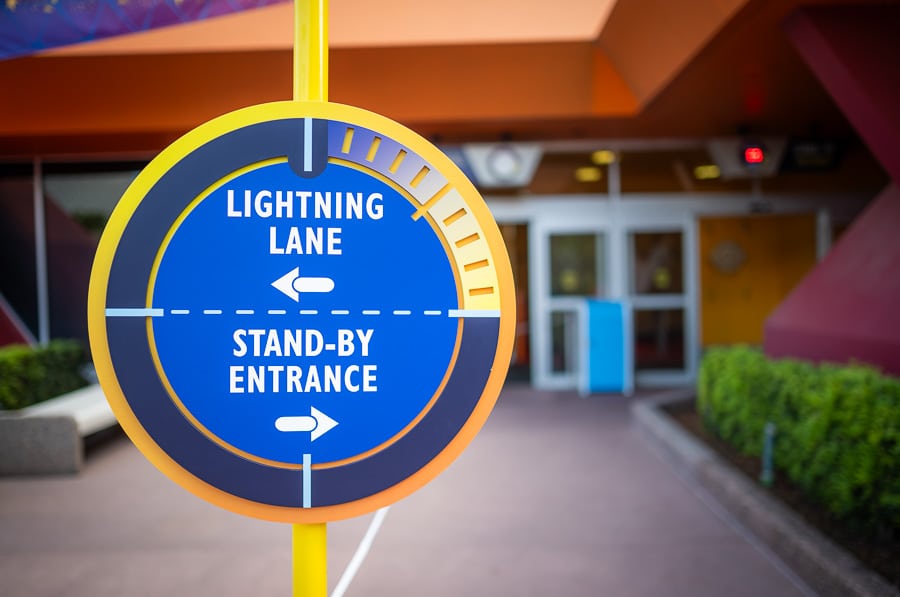

Anecdotally, my experience while in the standby lines is definitely not that 4 people are being pulled from the Lightning Lane for every one guest from the standby line. I’m not out there counting the people passing, but I wouldn’t be the least bit surprised if the numbers skewed slightly in favor of standby. It’s certainly nothing like the 10:1 ratio in favor of Lightning Lanes that can happen during peak times.
Since I’m doing strategy field testing as part of solo research trips, I’m usually standing in line by myself. And because I apparently like to torture myself, I’ve developed a habit of watching the Lightning Lane guest flow to get an idea of how and when the standby line will move. In the past, this has been needlessly anxiety inducing. Definitely not recommended, as it’s no fun to see a steady stream of people passing as you stand still.
That hasn’t been the case in the last 6 months. I’ve noticed it on several different attractions, but where it was most pronounced was, again, during my TRON Lightcycle Run testing. I was honestly surprised that, despite Lightning Lane Single Pass being totally sold out, the standby line was manageable and moving. I had experienced much, much worse when TRON was using a virtual queue last year.
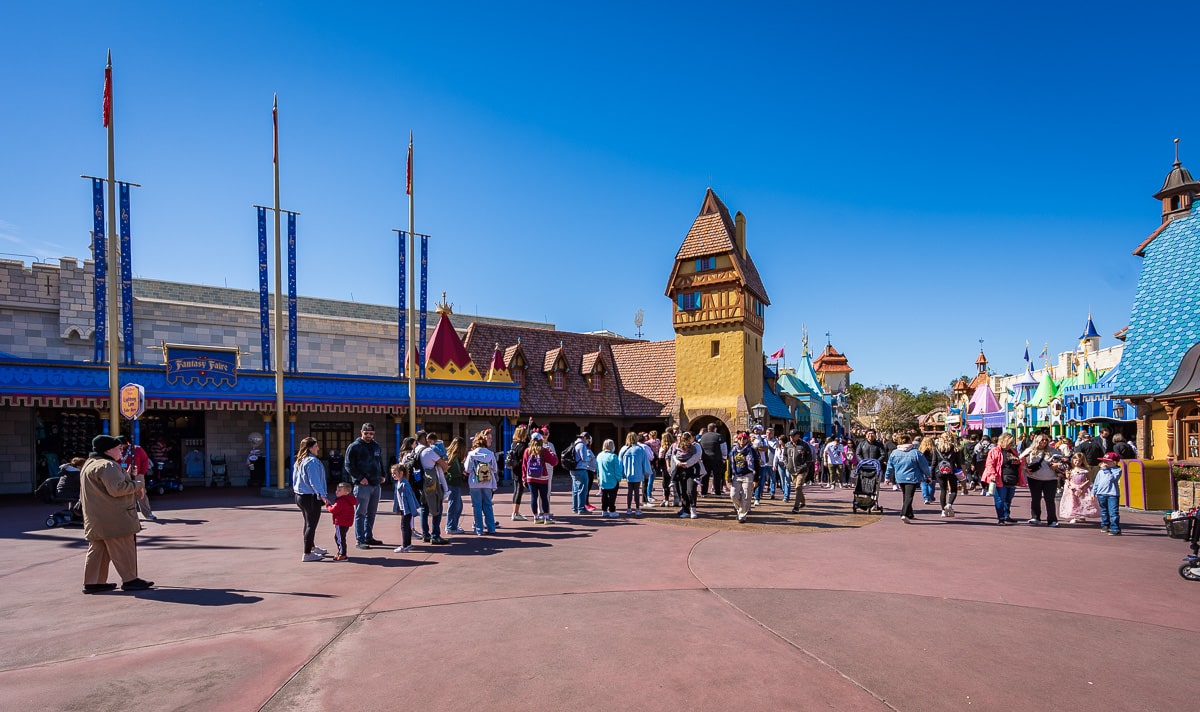

It’s not just TRON, either. There are several other attractions that used to regularly use overflow queues for the Lightning Lanes. There were times when Peter Pan’s Flight would back up past PhilharMagic, Seven Dwarfs Mine Train would have multiple switchbacks (via tape on the ground), Space Mountain had a line out to the TTA track, etc.
This can still happen from time-to-time, especially on peak days or after rides return from excessive downtime. But it was previously occurring with regularity, even on off-season days last September or moderate days this winter. I haven’t seen Lightning Lanes that consistently backed up in the last 6 months.
(Note that this only applies to Walt Disney World. This problem still occurs at Disneyland with some degree of regularity. I don’t think it’s quite as bad as before, but it’s nothing like the night-and-day difference at Walt Disney World.)


To that point, the explanation for this is not Lightning Lane Multi-Pass or Single Pass being significantly less popular than their predecessors. To the contrary, Lightning Lane Single Pass is selling out much more often than Individual Lightning Lanes did, even in low to moderate crowd levels.
The likely reasons for this are beyond the scope of this post, but it’s something we address at length in Lightning Lane Single Pass is Selling Out FAST! The circumstances haven’t really changed since that post was published. The title there really says it all, but suffice to say, several of these LLSPs are now fully booked up in advance or have limited same-day availability.
We’ve seen something similar with higher demand and more limited inventory for Lightning Lane Multi-Pass. That was covered in What’s Up with Lightning Lane Multi Pass Availability at Walt Disney World? The circumstances have changed since that post was published, as LLMPs have gotten easier to book–but still more competitive than Genie+ Lightning Lanes.


Our initial explanation for this in the days that followed the launch of Lightning Lane Multi-Pass and Single Pass was throttled availability. That made sense initially, as the new system was brand new and Disney was unsure of what to expect, so they likely wanted to slowly open the valve on Lightning Lane inventory.
In the months that have followed, this seems to have changed. While it remains true that there can be limited availability–especially for Single Pass–it’s not as bad as before. Moreover, our experiences in testing Lightning Lane Multi-Pass have demonstrated that same-day availability (or ride reservation refills) is fairly robust.
At this point, it seems like demand is fairly strong for Lightning Lanes, but also that Walt Disney World is doing a fairly good job of meeting this. As for why demand would remain robust, our best explanation is heightened FOMO and FUD–two of my favorite “facronyms.”
Since guests are no longer buying Lightning Lanes same-day, it’s more difficult to assess the need for them and adjust accordingly during your vacation. As such, there’s likely a tendency to “over-purchase” Lightning Lanes as compared to under the old system. (Another subject that’s beyond the scope of this post, but it’s worth reading our recent post: When You Should Skip Lightning Lane Multi-Pass.)


As we’ve also noted, Lightning Lane Premier Pass also hasn’t really moved the needle on utilization.
This was to be expected, as the target audience for LLPP is exceedingly limited. It’s my understanding that fewer than 1% of guests have been purchasing Lightning Lane Premier Pass on the vast majority of days. That’ll be higher around Christmas and New Year’s Eve when crowds are higher, especially at Magic Kingdom and Disney’s Hollywood Studios, but it’s still unlikely to eclipse 2% of all guests.
This is precisely why Walt Disney World expanded eligibility for Lightning Lane Premier Pass. Not only is it being used by a very low percentage of guests, but they have the excess bandwidth in the Lightning Lanes to open it up to more guests without the system even coming close to its breaking point. The bottom line is that Walt Disney World has expanded its paid line-skipping systems and they’re still performing far better than before. How do we make sense of that?
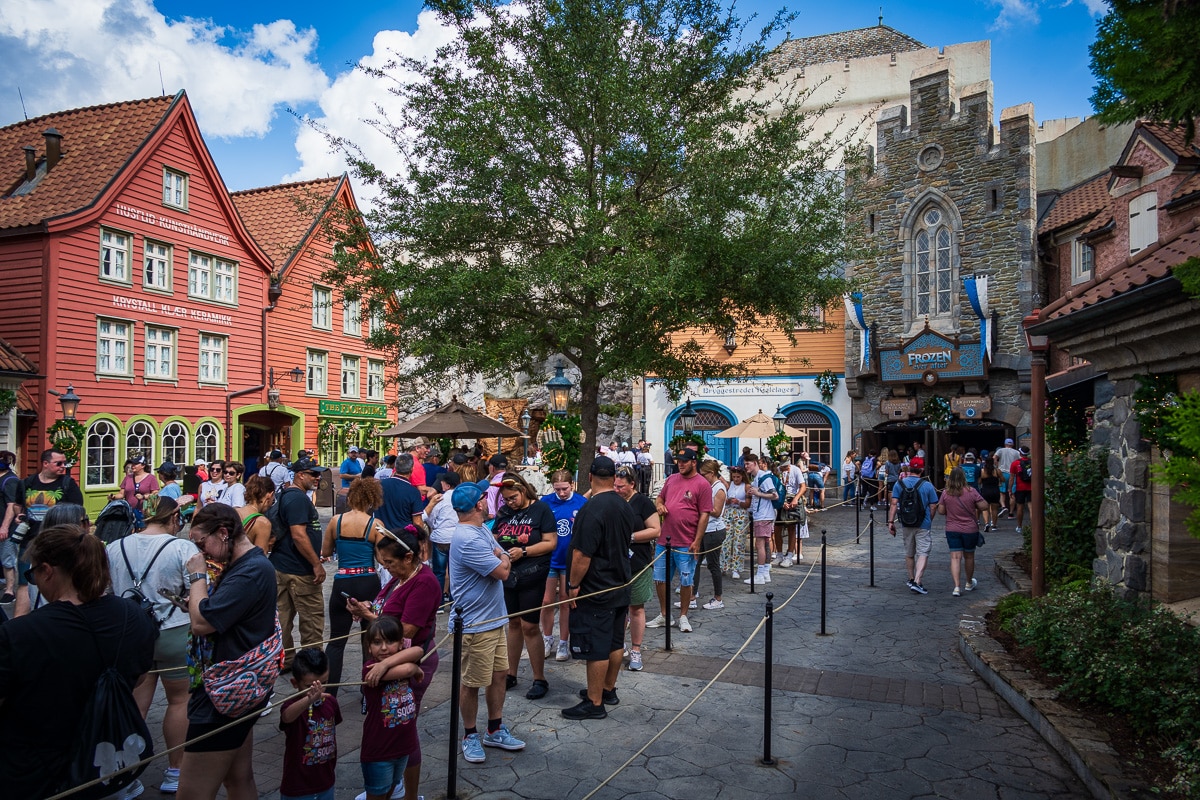

The elephant in the room is that the overhaul of Disability Access Service to reduce abuse and misuse is what’s having the biggest impact on both wait times and decreased utilization of Lightning Lanes. I hesitate to even broach this topic since it has real human consequences and has been heartbreaking to read the stories of DAS denials.
However, it’s all but certain that the DAS overhaul isn’t just a contributing factor, but is the primary reason for shorter standby lines and less Lightning Lane usage. This was one of the driving forces behind the crackdown, so it makes complete sense. Everything we had heard even prior to the overhaul announcement suggested DAS usage had exploded and was the primary cause of usage of Lightning Lanes, not paid sales.
As we’ve said repeatedly in other contexts, queueing is a zero-sum game. This isn’t even theoretical–Disney has been sued over accommodations for disabled guests in the past, and these stats have come out during discovery and testimony (see A.L. vs. Walt Disney Parks & Resorts, US). A test study during that revealed that DAS users experienced, on average, 45% more attractions than those without DAS.


Keep in mind that this study would’ve been conducted several years ago, under the old free FastPass+ system and prior to the explosion of TikTok and Facebook groups that encouraged and facilitated abuse. It stands to reason that guests who are actually disabled and need DAS are able to experience fewer (probably far fewer) attractions than fraudsters who game the system to essentially create a free FastPass exploit.
Of course, this also comes at the expense of disabled guests who need DAS in order to enjoy Walt Disney World and are being unfairly denied as part of the crackdown. While it’s good to see the abusers being denied, there is also collateral damage to this. Many guests who are actually disabled have been swept up in the crackdown–it’s unfortunate there’s no way to narrowly target the abusers. I won’t pretend to know what the “perfect” solution is–but I do know that the status quo is devastating, and that Disney can and should do better.
However, that’s also beyond the scope of this post. This is about shorter standby lines and less Lightning Lane usage despite demand staying strong. And given all of the above, I do not know how to reconcile all of that without attributing it to the DAS overhaul. There are undoubtedly other contributing factors (shifting demographics, parks continuing to restore lost capacity, etc), but the primary driver is undoubtedly DAS.


Ultimately, that’s our theory as to why standby lines are shorter and faster moving at the same time that Lightning Lane usage has decreased, even with demand for Multi-Pass and Single Pass appearing fairly strong and ride reservation inventory being healthy. This strikes us as the only plausible conclusion based Disney’s quarterly results, wait times data, and our extensive anecdotal experiences.
As we’ve mentioned before, there was an internal desire within Walt Disney World to better balance the interests of guests using standby lines and Lightning Lanes, and that appears to have been accomplished. But again, we’d be remiss if we didn’t acknowledge that this occurred with disabled guests as the collateral damage. It’s saddening that this has happened, and we still believe Walt Disney World could narrowly tailor the system in a way that targets abusers (who were a significant number of users).
Planning a Walt Disney World trip? Learn about hotels on our Walt Disney World Hotels Reviews page. For where to eat, read our Walt Disney World Restaurant Reviews. To save money on tickets or determine which type to buy, read our Tips for Saving Money on Walt Disney World Tickets post. Our What to Pack for Disney Trips post takes a unique look at clever items to take. For what to do and when to do it, our Walt Disney World Ride Guides will help. For comprehensive advice, the best place to start is our Walt Disney World Trip Planning Guide for everything you need to know!
YOUR THOUGHTS
If you’ve visited Walt Disney World in the last 6 months, what’s been your experience with standby lines, Lightning Lanes, and the flow of traffic in both versus previous visits? How about as compared with in-park congestion? Have you noticed any discernible differences? Would you recommend LLMP or just advise sticking to standby given these trends? Do you agree or disagree with my assessment? Any questions we can help you answer? Hearing your feedback–even when you disagree with us–is both interesting to us and helpful to other readers, so please share your thoughts below in the comments!

